
![]()
Retrieve and organize knowledge of the key aspects of the alternative technologies and prepare a comparison with the current technology.
Method Method = FORMAT methodology
Define criteria for measuring the performance of the STFSTF = System to be forecasted and its alternatives. Along with performance, define a structured list of resources needed (expenses) for the systems to work.
Instructions
- Recall
- questions of forecast defined in Stage FORFOR = FORmulate .
- functional model (step 1 in Stage M Add a Tooltip Text)
- the list of alternative technologies (step 2 in Stage M Add a Tooltip Text)
- Browse the alternatives and define the main factors for selecting one solution against the others.
- Define criteria for measuring the performance of the systems:
- think about the OUTPUT of the function of the STFSTF = System to be forecasted , as defined in Step 1 of Stage M Add a Tooltip Text.
- Explore, if needed, the relevance of the functional performance to the questions of forecast.
- Consider the alternative technologies in terms of:
i. Achievement of threshold values,
ii. Versatility/Flexibility,
iii. Robustness (of results),
iv. Controllability,
v. Capability to work in different conditions.
- Define criteria for measuring the expenses of the competing systems.
Expenses here are not strictly costs, but any kind of expenses needed to make the system work.
Consider the following, general set of resources that can be consumed by the STF or by the alternative technologies:
i. Time resources,
ii. Information and knowledge resources,
iii. Material resources,
iv. Energy resources,
v. Space resources.
- Organize (or re-organize, if necessary) the criteria in a list, so that they are categorized as performance and expenses.
Tips
➔ In order to facilitate the definition of the criteria,consider the pros and the cons (advantages and drawbacks, strength and weaknesses) of each solution against the others. These pros and cons, once transversally linked by meaning-associations among the alternatives, shall allow the emergence of the main criteria relevant to the technological competition.
➔ In order to understand the real impact of the resources that the systems consume, don’t forget to consider the resources that the system may need before its use (e.g.: during transportation, installation) or after (e.g.: during disassembly, disposal).
➔ If possible, gather expert opinions on the different competing technologies.
➔ If a specific measure of performance or expenses appear for just one of the alternatives, it may be an outlier capable of addressing a niche or, on the contrary, a potential emergence of a new factor for competition.
➔ In case the time boundaries for the forecasting activity would not allow a thorough and comprehensive analysis of these factors, limit the investigation to the ones that the panel of analysts and experts consider the most relevant.
➔ The criteria to measure the performance and the expenses of the STFSTF = System to be forecasted and its alternatives/competitors can be conveniently organized by means of the (Element-Name-Value) ENV model (FORMAT Deliverable 2.2), differentiate the name of what is measured and its corresponding value. Please refer to the Example at the end of the Step to clarify this aspect.
➔ When defining a measurement criterion, do not limit yourself to available data. Keep in mind the possibility to account variables that are not measured yet in the current practice..
➔ Ask the experts about the availability of data for the chosen measures of performance and expenses.
➔ As for the previous steps, it is also possible to organize knowledge, information and data about performances and expenses of the STF and its alternatives in the System Operator structure. The last example of this section shows how to deal with performances and expenses, as they are expressed in the first example. Especially for this step of the methodology, the organization of data, information and knowledge within this framework allows speeding up the execution of the subsequent steps.
Suggested reading
Becattini, N., Cascini, G., Petrali, P., & Pucciarini, A. (2011). Production processes modelling for identifying technology substitution opportunities. In Proceedings of the 11th TRIZ Future Conference (pp. 17-33).
Becattini, N., (2013). Requirements identification and characterization in innovation processes. PhD Dissertation available here.
Becattini N, (2013) Product and Process Modelling – State of the Art Update – FORMAT Project Deliverable 2.2
Example
Examples of criteria for measuring performance and expenses:
Excerpt of criteria for transport systems (STFSTF = System to be forecasted : Car; Alternatives: Train, Airplane, Bicycle,…).
Table 1 is based on both qualitative and quantitative criteria. Criteria are in the first column, in bold. In the same column, in brackets, it is clarified if the measure pertains the performance (P) or the expenses (E) of the technical system. Please note that the values in the tables have merely the function of clarifying the identification of criteria for comparisons.
Table 1: measurement criteria for comparing transport systems.
| ALTERNATIVES | ||||
| CRITERIA | Car | Train | Airplane | Bicycle |
| Maximum distance without stops (P) | 500-1000 km | 500-1000 km | 1000-15700 km | 40-80 km |
| Maximum speed (P) | 150 km/h | ≈400 km/h | ≈1000 km/h | 20-40 km/h |
| Amount of transportable people (P) | 5 | ≈700 | 30-300 | 1 |
| Room occupied by the system (footprint) (E) | ≈1,5 x 3 m | ≈3×320 m | 73×80 m (A380) | 0,30×1,20 m |
| Distance to get in from home (E) | 50 m | 2-10 km | 60 km | 10 m |
| Average distance between two refilling stations (E) | Every 30÷50 km in highways, 1÷3 km in cities | Main train stations for diesel trains (50÷100 km) | Distance between connected airports (300-15000 km) | No need of refuelling |
| Amount of alternative pathways to destination (in a 30 mins long trip) | 1÷10 | 1÷3 | 1 | 1÷50 |
| Tank Capacity (E) | ≈30÷80 litres | ≈6000 litres | >300000 litres | 0 |
| Number of doors (E) | 3 to 5, including trunk door | 4 doors per each coach, on average | 16 doors (A380) | 0 |
| Number of windows (E) | 6 (1 front, 1 rear, 4 on the sides) | ≈16÷20 windows per coach on average | ≈200 (A380) on the fuselage | 0 |
| Passenger’s Safety (E) | High | High | Maximum | Not so high |
| Required fuel (E) | Gasoline | Electric energy or Diesel | Avgas or Kerosene | Human propulsion |
With reference to the organization of such information in terms of the ENV model, the following table reorganizes the first column of Table 1 with that perspective. Please note that the last column of Table 2 does not include actual values, but units of measurements (specific values depend on the vehicle to be considered and they can differ significantly.)
The evolutionary analysis required at the Stage A A = Act , step 3, can benefit from the organization of such values with a time-related perspective.
Table 2: generalized measurement criteria for comparing transport systems with explicit distinction between the name of the comparison parameters and the units to measure their values.
|
CRITERIA |
Element it belongs to | Name of the parameter |
Value of the parameter |
|
Maximum distance without stops (P) |
Vehicle | Range of movement (no stops) |
[m] or [km] or [mi] |
|
Maximum speed (P) |
Vehicle | Top Speed |
[km/h] or [mi/h] |
|
Amount of transportable people (P) |
Vehicle | Maximum passengers load | [# (number)] |
| Room occupied by the system (footprint) (E) | Vehicle | Surface occupation |
[m2] or [ft2] |
|
Distance to home (E) |
User | Distance to reach the vehicle | [m] or [km] or [mi] |
| Average distance between two refilling stations (E) | Refilling stations | Distance to next RS |
[m] or [km] or [mi] |
|
Amount of alternative pathways to destination (in a 30 mins long trip) (E) |
Pathways | Amount of alternatives | [# (number)] |
| Tank Capacity (E) | Tank | Volume |
[dm3] or [ft3] or [litres] |
|
Number of doors (E) |
Doors | Overall amount | [# (number)] |
| Number of windows (E) | Windows | Overall amount |
[# (number)] |
| Passenger’s Safety (E) | User | Safety | [QUALITATIVE] |
| Required fuel (E) | Vehicle | Allowed propellant | [QUALITATIVE] |
For what concerns the last two rows of Table 2, the units of measurement haven’t been made explicit because of the qualitative nature of the parameter to be measured. Please consider that the same analysis could have been tackled from a more quantitative perspective.
The following reformulations capture different nuances (qualitative/quantitative) concerning the same overall criteria to be considered for technology comparison.
Table 3: reformulation of the qualitative parameters of Table 2 so as to allow a quantitative comparison.
| Criteria | Element | Name of the parameter | Value of the parameter | Qualitative vs Quantitative |
| Passenger safety (E) | User | Safety | [-] | Qualitative |
| Vehicle | Amount of safety devices per passenger | [#] | Quantitative | |
| Required fuel (E) | Vehicle | Allowed propellant | [-] | Qualitative |
| Vehicle | Amount of propellant suitable for the engine | [#] | Quantitative |
Example: criteria for measuring performance and expenses within the logic of System Operator
As mentioned in the tips, also the criteria to measure performances and expenses might be organized within the overall structure of the System Operator. Especially along this step, such a structured data management becomes beneficial for the whole forecasting study. Subsequently, the data retrieved in the rest of the investigation should be examined with a historical perspective, so as to extract qualitative trends to be further confirmed by quantitative evidences. Figure 1 shows how the parameters highlighted along Table 2 (from the criteria reported in Table 1) can be placed among the different levels of the System Operator. Please note that parameters referring to:
- the whole vehicle have been placed in the cell concerning the “System level – Present”;
- the contexts in which the transport system is used have been placed in the cell concerning the “Super-System level – Present”;
- the parts or components of the vehicle have been placed in the cell about “Sub-System level – Present”.
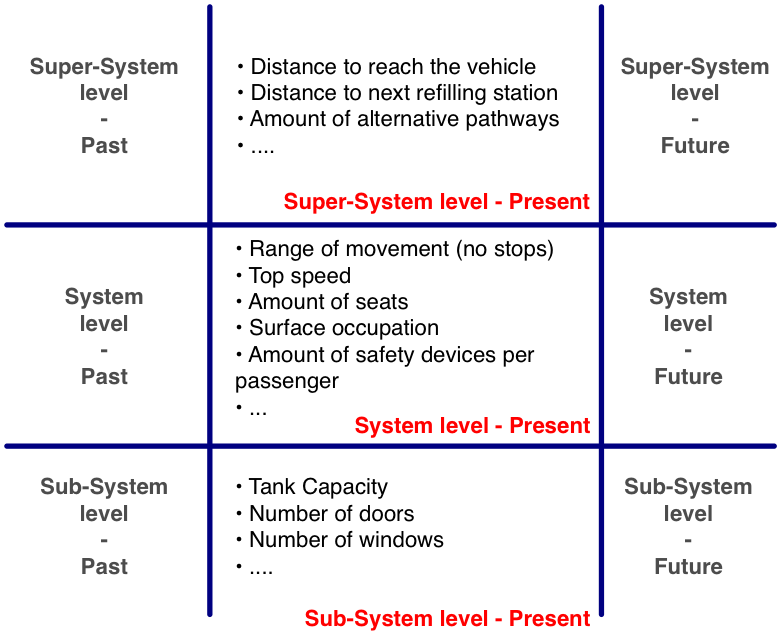
Figure 1:The parameters identified along the first example to characterize performances and expenses of transportation systems.
Moreover, it might happen that while searching for information relevant for the forecasting analysis, you get in touch with data about those parameters. In case you consider those data useful to answer the forecasting questions formulated along the FOR Stage, it is suggested to distinguish data about the current situation from those pertaining to the past. The former should be placed in the central column of the System Operator, while the latter should be used to feed the column on the left. It is also possible, even if less common, that you get in touch with some data about the future values of measurable parameters (e.g.: in case a law sets future standards about emissions, when reliable predictions about some contextual data are available, etc.). Future-related data should be organized consistently with the hierarchical level on the column on the right hand side. Thus, figure 2 aims at clarifying that data should not be placed only in the central column of the System Operator, but they should be properly organized on a time perspective before understanding qualitative trends about the STF and what relates to it.
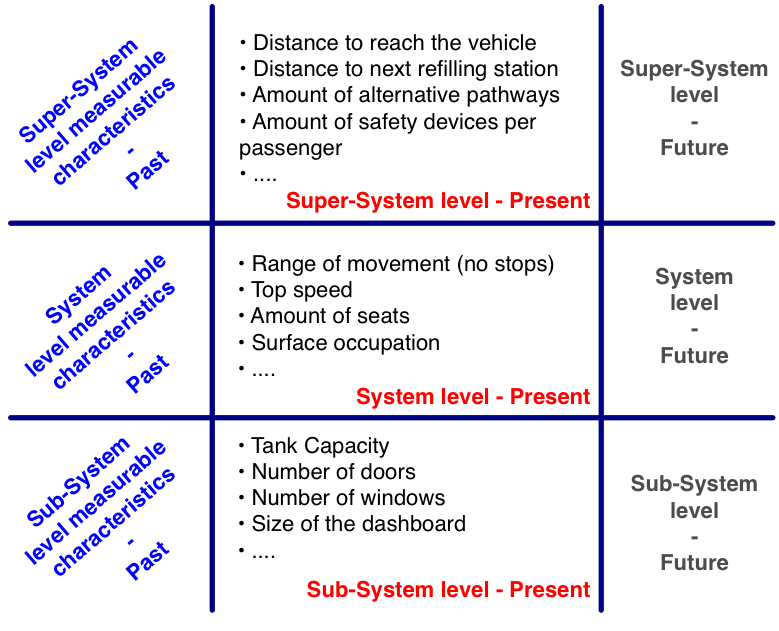
Figure 2: The System Operator also supports the organization of data to be retrieved with an historical perspective. The column on the left (Past, in blue) is highlighted because it is common to retrieve data describing also past conditions for the STF, its parts or the context it works in. The column about the future has been left in dark grey, but it is also possible to find some data about future plans, standards or regulations.