
![]()
To identify future traits of the system to be forecasted (STFSTF = System to be forecasted )
Method Method = FORMAT methodology (it is a tooltip test)
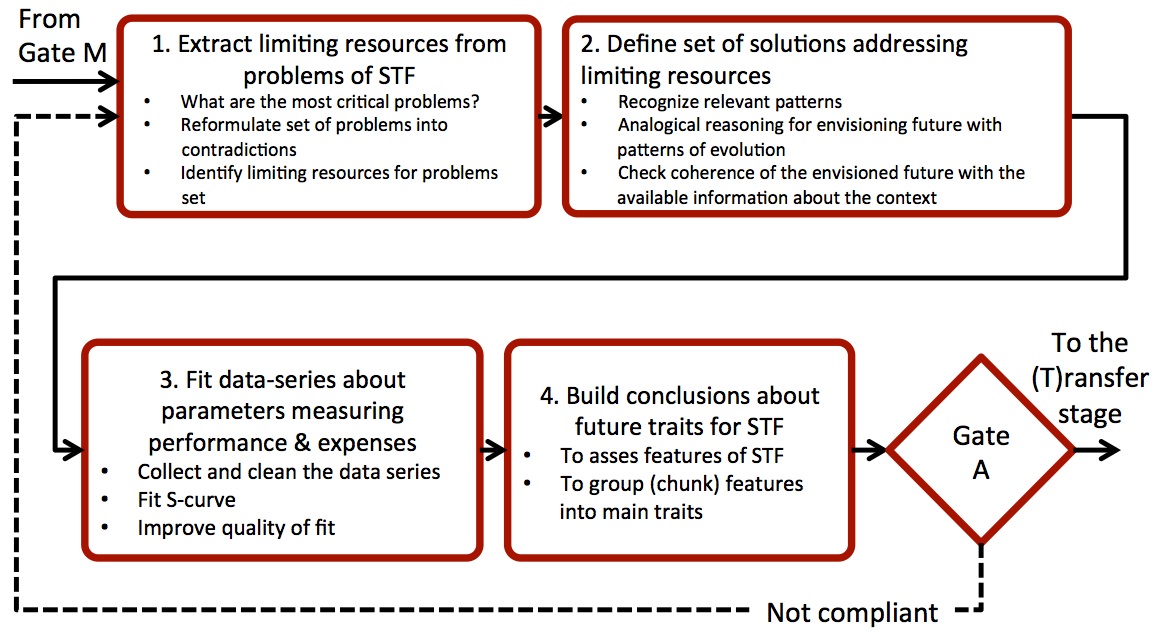
The main function of Stage A is to develop a consistent set of future traits of system to forecast and prepare all needed components for answering forecasting question(s). Stage A consists of the application of four complementary studies. Step one works on problem identification and assessment of limiting resources. Step two studies the patterns of evolution regarding a system, identified problems, limiting resources and system’s contexts. Beyond the first two qualitative studies, Step three introduces the quantitative assessment of the growth of selected variables by means of a logistic S-curve using regression analysis. The three steps of study are followed by a harmonization and reconciliation at Step four.
Prerequisites:
Knowledge
Knowledge acquired within Stage FOR and Stage M is required. Understanding how to apply analytic Tools (see the list below) is necessary. Abilities to analytic work and to communicate with experts are essential.
At least one member of the core team should be familiar with analogical reasoning applied to evolutionary patterns, e.g., the application of the TRIZ Laws of Engineering Systems Evolution to envision possible evolutionary scenarios of technical systems.
Knowledge about global megatrends is welcome.
Time
5 working sessions of 4h each within 20 working days
Material
Access to patent databases, scientific literature, market data, repositories of statistics etc.
Datasheets and catalogues related to the STF and to the relevant subsystems and supersystems identified in stage M; data should be available in the form of time series and not just punctual values about the present.
People
2-4 analysts + Users of forecast + Invited Experts
Tools
System Operator; Contradiction model; Laws of Technical system evolution; Logistic growth curves, regression analysis; ENV models
Software
Software to work with conceptual maps, Software to work with Logistic growth curves and make regression analysis
Instructions
- Extract limiting resources from problems of STFSTF = System to be forecasted
Identification of problems makes us focus on reasons for future change in a system. Each problem is linked to one or more resources that hinder its solution:
- What are the most critical problems?
- Reformulate set of problems
- Identify limiting resources for the formulated problems
Knowledge about limiting resources supports reliability of interpretation for results from step two and three of Stage A.
- Define set of solutions addressing limiting resources
Explore evolution of the STFSTF = System to be forecasted with its components and context. Use the model of the STFSTF = System to be forecasted from M Add a Tooltip Text, look for problems and solutions already applied to the system. Research past solutions and envision future solutions:
- Recognize relevant patterns
- Envision future technology developments with patterns of evolution and reasoning-by-analogy
- Check coherence of the envisioned future with available information about the context
- Fit data-series about parameters measuring growth of STF or its context.
Quantitative analysis completes an understanding of the system’s future after qualitative studies. Growing variables describe the system from past to present. Fitted data series together with the results of a study in problems, limiting resources and evolution trends, provide a comprehensive view into the future of the STF.
- Collect and clean the data series
- Fit S-curve
- Analyse the quality and the reliability of the fit and improve if necessary
- Build conclusions about future traits for STFSTF = System to be forecasted
Combine the results of the study done in Stage A. The aggregated set of data consists of problems, limiting resources through evolutionary trends and data series fits. Collective overview of this information and data provides understanding of the STF and provide a guideline of future development:
- To assess main features of future STF
- To group (cluster) features into main traits
Tips
- It is essential to have the latest version of outputs from Stage FOR and Stage M well-organized.
- Step 1 of Stage A consists in a problem-driven anticipation of future traits of the STF: the forecast is built through a discussion about the expected problems to be addressed and the limiting resources that characterize the STF.
- Step 2 approaches the definition of STF future with a solution-driven logic: possible evolutions of the STF are envisioned by analogy, triggered by generalized patterns of evolution.
- The first three steps can be carried out in parallel, despite the analysis performed at Step 1 is beneficial to better focus the reasoning at Step 2. As well, the outcomes of Steps 1 and 2 are useful to identify relevant variables to analyse with quantitative models in Step 3. Step 4 is done after the final versions of three previous steps are finalized.
- When performing Step 1, it is recommended to formulate problems as contradictions. However, when there is a lack of skills about modelling systems in terms of contradictions, a simplified template can be applied to express a problem: “How to <required action> when <the real-case limits>?”
- When performing Step 1, the unit of measure has to be allocated to each limiting resource. It makes results of study measurable when it is appropriate.
- When performing Step 2, it is recommended to provide the evidence of the identified trends with supporting information (e.g. through patent searches). This practice improves the reliability of forecast.
- In a regular application of the methodology, number of sessions and duration of Stage A depend on competences of working team and availability of required data.
Suggested reading
[1] Altshuller, G. S., & Williams (transl.), A. (1984). Creativity as an Exact Science: The Theory of the Solution of Inventive Problems. New York: Gordon and Breach Science Publishers.
[2] Becattini, N. (2013). Product and process modelling – state of the art update (p. 59). Milan. Retrieved from http://www.format-project.eu/deliverables/public-reports-and-white-papers/deliverable-2.2/at_download/file
[3] Kucharavy, D (2014). Contradictions in the domain of technological forecasting. (p.9) Milan. Retrieved from http://www.format-project.eu/deliverables/white-papers/november-2014-contradictions-in-the-domain-of-technological-forecasting/at_download/file
[4] Kucharavy D. and R. De Guio (2008) Technological Forecasting and Assessment of Barriers for Emerging Technologies, IAMOT 2008. Dubai, UAE, p. 20.
[5] Kucharavy D., R. De Guio, L. Gautier, and M. Marrony (2007) Problem Mapping for the Assessment of Technological Barriers in the Framework of Innovative Design, in 16th International Conference on Engineering Design, ICED’07.
[6] Cascini, G., Rotini, F., and Russo, D. (2011). Networks of trends: Systematic definition of evolutionary scenarios. TRIZ Future Conference 2008, Procedia Engineering, 2011, Vol-9,p. 355-367.
[7] Cascini, G. (2012). TRIZ-based Anticipatory Design of Future Products and Processes. Journal of Integrated Design and Process Science, 2012, Vol-16 (3), p. 29-63.
[8] Nikulin, C., Graziosi, S., Cascini, G., and Stegmaier, R. (2013). Integrated Model for Technology Assessment and Expected Evolution: A Case Study in the Chilean Mining Industry. Journal of Integrated Design and Process Science, 2013, Vol-17(4), p-53-80.
[9] Rosen C. (2000). World Resources 2000-2001 People and Ecosystems: The Fraying Web of Life, Elsevier Science, 2000, 389 pages.
[10] Meyer, P. S., Yung, J. W. and Ausubel, J. H. “A Primer on Logistic Growth and Substitution The Mathematics of the Loglet Lab Software”. Technological Forecasting and Social Change. 1999. Vol-61. p. 247–271.
[11] Modis T., Natural Laws in the Service of the Decision Maker: How to Use Science-Based Methodologies to See More Clearly further into the Future. Growth Dynamics, 2013, p. 243.
[12] Yoon, B., and Lee, S. “Applicability of Patent Information in Technological Forecasting: A Sector-specific Approach”. Journal of Intellectual Property Rights. 2012. Vol. 17. p. 37–45.
[13] Logistic Analysis: Loglet Lab 2- http://phe.rockefeller.edu/LogletLab/2.0/
[14] Logistic Substitution Model II: http://www.iiasa.ac.at/web/home/research/researchPrograms/ TransitionstoNewTechnologies/download.en.html
[15] Nikulin, C. Technological Forecasting supported by Logistic Growth Curve analysis: software tool for increased usability (p. 4) Milan. Retrieved from http://www.format-project.eu/deliverables/white-papers/july-2013-technological-forecasting-supported-by-logistic-growth-curve-analysis-software-tool-for-increased-usability/at_download/file
[16] Logistics Curve Software (FORMAT Prototype): http://handbook.format-project.eu/?page_id=354
[17] ENV Model in G. Cascini, F. S. Frillici, J. Jantschgi, I. Kaikov, and N. Khomenko, TETRIS: Teaching TRIZ at School, EN 1.0. TETRIS project and the Lifelong Learning Programme, 2009. (pp.20-24) http://www.tetris-project.org/
[18] OTSM ENV Fractal Model in N. Khomenko, Keynote presentation for 6th TRIZ Symposium in Japan, Tokyo, September 2010 (pp.31-39).
v.2