A B C D E F G H I J K L M N O P Q R S T U V W X Y Z
Stage
Literally, a stage is a level, degree, or period of time in the course of a process. The FORMAT methodology follows a stage-gate process, i.e. its activities are organized in stages, while gates represent the checkpoints distributed along the TF process. Stage can be performed using various techniques of methods, but it should produce a required output which is checked at Gate. Stage is represented by a rounded rectangle and a gate is represented by a diamond.
Context: Stage-Gates description of FORMAT methodology
System
A System is a group of interacting, interrelated, and interdependent elements/components performing a certain function.
The key idea of describing a system is that once the boundary has been described (a system is identified), then one describes: (a) the features of the system; (b) the features of the environment without the system which affect the system; (c) the interactions between system and environment.
In order to know anything, one has to make a distinction. Therefore, system is an artificial model to facilitate the learning process.
Sub-systems
A system in border of some larger system. Sub-systems are parts (components) of a parent system.
Super-systems (context, holon)
A system that includes the analyzed system as a part. In other words, a super-system is a parent system for the examined system. For instance, the transport infrastructure is a super-system for a particular type of transport system.
Practical expression or relation between super-system and system:
- Super-system is a system that in order to work requires an existence of a system.
- There is a demand to a system that comes from a super-system.
Context: System operator, Law of system completeness
S-curve models
Simple logistic S-curve model
Simple (symmetric) logistic S-curve model is an equation suggested first time in 1838 by Pierre-Francois Verhulst as a model of population growth. The initial stage of growth is approximately exponential; then, as saturation begins, the growth slows, and at maturity, growth stops [ http://en.wikipedia.org/wiki/Logistic_growth ]. There are several logistic curves, one of the most popular equations is described below:
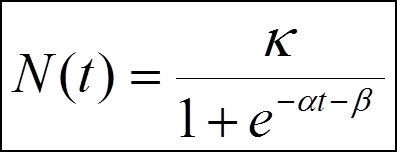
Where,
α – growth rate parameter, time required for growth trajectory from 10% to 90% of limit κ
characteristic duration (Δt); β – parameter specifies the time ™ when the curve reaches 0.5κ midpoint of the growth trajectory ™; κ – is the asymptotic limit of growth (κ) [Weisstein, E.W. Logistic Equation. (MathWorld A Wolfram Web Resource, 2003)].
This model describes a dynamics of growth under competition: Natural growth of autonomous systems in competition might be described by LOGISTIC EQUATION and logistic S-curve. Natural growth is defined as ability of a ‘species’ to multiply inside finite ‘niche capacity’ through time period.
For socio-technical systems the three-parameter S-shaped growth model is applied for describing “trajectories” of growth or decline through time.
Fisher-Prey transform
Fisher-Prey transform is a change of variables that normalizes a logistic curve and renders it a straight line.
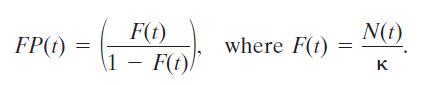
Where,
t – time; N(t) – size of population at t; κ – is the asymptotic limit of growth [P. S. Meyer, J. W. Yung, and J. H. Ausubel, “A Primer on Logistic Growth and Substitution: The Mathematics of the Loglet Lab Software,” Technol. Forecast. Soc. Change, vol. 61, no. 3, pp. 247–271, 1999].
This transform facilitates comparison to other logistic growth processes, as soon as all the curves are normalized to limit of growth κ, more than one logistic can be plotted on the same chart. Therefore, competition of multiple systems over time can be simulated and analyzed.
Bi-logistic (component logistic models)
Bi-logistic is a model applied for a system that experiences growth in two discrete phases. In this model, growth is the sum of two discrete curves, each of which is a three-parameter logistic [P. S. Meyer, J. W. Yung, and J. H. Ausubel, “A Primer on Logistic Growth and Substitution: The Mathematics of the Loglet Lab Software,” Technol. Forecast. Soc. Change, vol. 61, no. 3, pp. 247–271, 1999].
Multiple logistic (component logistic models)
Multiple logistic are models where growth is the sum of n simple logistics [P. S. Meyer, J. W. Yung, and J. H. Ausubel, “A Primer on Logistic Growth and Substitution: The Mathematics of the Loglet Lab Software,” Technol. Forecast. Soc. Change, vol. 61, no. 3, pp. 247–271, 1999].
Logistic substitution model
“The logistic substitution model describes the fraction of the niche or market share of the competitors. The life cycle of a competitor can be partitioned into three distinct phases: growth, saturation, and decline. The growth and decline phases represent logistic growth processes, which as we will see, influences the saturation phase[2].”
The assumptions behind the logistic substitution model, as developed by Nakicenovic and Marchetti [Marchetti, C., and Nakicenovic, N.: The dynamics of energy systems and the logistic substitution model. IIASA Research Report RR-79-13. International Institute for Applied Systems Analysis, Laxenburg, Austria, 1979] are:
- New technologies enter the market and grow at logistic rates.
- Only one technology saturates the market at any given time.
- A technology in saturation follows a non-logistic path that connects the period of growth to its subsequent period of decline.
- Declining technologies fade away steadily at logistic rates uninfluenced by competition by new technologies.
Lotka-Volterra competition model
The Lotka–Volterra equations, also known as the predator–prey equations, are a pair of first-order, non-linear, differential equations frequently used to describe the dynamics of biological systems in which two species interact, one as a predator and the other as prey. They were proposed independently by Alfred J. Lotka in 1925 and Vito Volterra in 1926, neither of whom were biologists [ http://en.wikipedia.org/wiki/Lotka-Volterra_equations].
Context: FORMAT methodology
[2] [P. S. Meyer, J. W. Yung, and J. H. Ausubel, “A Primer on Logistic Growth and Substitution: The Mathematics of the Loglet Lab Software,” Technol. Forecast. Soc. Change, vol. 61, no. 3, pp. 247–271, 1999.]